APPENDIX H. Interim BMAR Cost Estimating Methods
Method 1 - This method of BMAR calculation has been developed and
is being tested by NASA maintenance managers at Dryden Flight Research
Center (DFRC). DFRC is using a statistical analysis of the condition code,
estimated replacement costs for inventory items and detailed repair cost
data from their CMMS.
The process involves selecting a representative
(random) sample (based on the confidence level desired) of equipment items
in each of the five standard condition codes and the appropriate repair or
replacement cost for those items. The ratio of repair cost to replacement
cost for each of the inventory items selected is calculated and averaged
to determine a condition code factor (CCF) for each condition code. The
CCF is then multiplied by the total replacement cost for all equipment
items in that condition code. This product is then summed for all
condition codes to produce a statistically generated total BMAR value based
on the actual condition of the plant.
Actual requirements (and condition codes for all
inventory items) were developed through a baseline condition assessment of
all equipment items, facilities and their major components. These
requirements are currently being expanded, validated and incorporated in
the CMMS as part of the normally scheduled PM/PT&I inspection process. All
requirements, including BMAR, are maintained in the CMMS. Actual
requirements can be extracted electronically from the CMMS. Equipment
requiring repair can be extracted from the CMMS in almost any terms
desired, and criticality codes, historical trouble call information and
cost data is also available in the CMMS for condition determination and
analysis purposes. The statistical methods proposed, if used properly,
will reduce objectivity concerns and produce a real-time BMAR calculation
based on the current condition, current replacement costs and detailed
repair costs.
This process is strictly condition-based, involves
some limited life-cycle cost procedures, statistically develops BMAR based
on real-time condition and costs and is developed from CMMS data. Each
step is described below along with the potential impact on other Centers
and Component facilities when the procedure is implemented NASA-wide.
Step 1 - Ensure inventory is accurate. Each Center should ensure
that its inventory of physical plant facilities and equipment is accurate
and is developed down to the component level. This is most important
because this method develops the BMAR estimate based on a percentage of
the plant Current Replacement Value (CRV). Most NASA Centers have either
recently validated their inventories or are in the process of doing it now,
and most have developed their inventories down to the component level.
Following the initial inventory, it then should be updated continuously as
facilities, systems and equipment are added and deleted. From a NASA-wide
standpoint, this step will not require significant resources to accomplish.
Step 2 - Complete a baseline condition assessment.
Each location should complete a baseline condition assessment. It is
imperative that the condition of all the physical plant inventory items is
known. Most NASA locations have completed a baseline condition assessment
or are in the process of completing one at this time. Following the
initial baseline condition assessment, the condition of each facility,
system and unit of equipment should be updated continuously based on
day-to-day input from the maintenance technicians, Facility Managers, users
and occupants. From a NASA-wide standpoint, this step will not require
significant resources to accomplish.
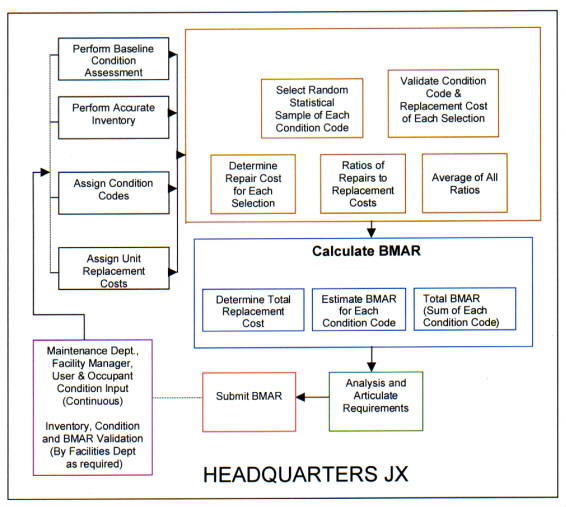
Figure H-1. Determining BMAR
Step 3 - Assign a condition code to all plant
facilities and equipment. The condition assessment level code to be
used should be simple, basic and easily understood. The condition codes
proposed in Method 2 add excellent parameters that succinctly describe
what the status of the item is and the scope of work required to bring it
to acceptable maintenance standards. Much of this information can be
provided from input by maintenance technicians, facility managers, users
and occupants. It is important that it is simple, but with sufficient
definition that everyone can at least attempt to apply it in a similar
manner. Most NASA Centers either already have condition codes established,
or are in the process of establishing them. Most condition data is or will
be contained in facility condition assessment (FCA) databases, and some are
in both the FCA and CMMS databases. It should not be a significant effort
on the part of the NASA Centers and Component facilities to complete this
action, and most are already in the process of completing it.
Step 4 - Assign Replacement costs. Current
replacement costs for all inventory items must be established in the
database to be used. Some NASA locations already have this information in
their FCA or CMMS database. It is important that this data be developed
from reputable cost reference data/guides. Most locations already use some
form of the R S Means Maintenance and Repair Cost Data. It is
recommended that the database that contains replacement cost data be set
up to automatically update the costs to accommodate inflation. This action
will be required at most NASA locations, but should not be too resource
intensive to accomplish.
Step 5 - Calculate the Condition Code Factor.
Calculation of the Condition Code Factor (CCF) will be peculiar to each
Center depending on the condition of its facilities and equipment.
(1) Randomly select a statistically appropriate
sample size (based on the confidence level desired) of inventory items for
each condition code. An electronic or manual statistical sample selection
table may be used to determine the appropriate and statistically accurate
sample size. Websites are available on the internet where the required and
statistically accurate sample size will be calculated at no cost by
inputting basic information such as total population and desired degree of
accuracy. On the web, search for statistical sample size and
several on-line calculating services (and software sales companies) will
be identified.
(2) Determine the condition code and replacement cost
for each of the items selected.
(3) Estimate the required repair costs for each of
the inventory items selected in each condition code.
(4) Divide the required repair costs for each item
selected by its corresponding replacement cost.
(5) Average the ratio of repair required to the
current replacement cost for all items selected in each condition code.
This is the CCF and there will be one for each condition code.
The most important part of this procedure is the
true random selection of an appropriate sample size of inventory items
within each condition code. This selection can be accomplished with the
use of an electronic random number generator given that all the needed
information is available in the database. Again, the randomness of
inventory item selection and the determination of the proper sample size
is key to the standardization and accuracy of the process. The
determination of the appropriate sample size should be based on the level
of confidence desired for the resultant BMAR approximation. The
application of this calculation throughout NASA will not require a
significant effort once the appropriate information is available in a
database.
Step 6 - Calculate the BMAR approximation.
(1) Determine the total replacement cost for all
inventory items included in each condition code.
(2) Multiply the CCF for each condition code by the
total replacement cost of all inventory items included in each condition
code. This is the estimated BMAR for each condition code.
(3) Sum the estimates of BMAR for each condition
code. This is the statistically estimated BMAR for the entire physical
plant for that location.
Step 7 - Use key management information for
articulating requirements and analysis. If the BMAR calculation is
accomplished from the CMMS database, additional information (criticality
codes, failure data and historical cost and trouble call data) will also
be available to further define and analyze the resultant BMAR calculation.
Even if the calculation is done in another database, some of this analysis
can be done manually, if necessary. Very few NASA locations have included
their condition assessment information in their CMMS or linked the two
databases. However, at most NASA locations, both databases are compatible
and could be linked in the future if resources are available and it was
deemed a cost-effective initiative.
Step 8 - Periodically validate condition codes.
If the condition codes are periodically verified, especially as part of an
already regularly scheduled maintenance inspection (PM/PT&I) or through
input from the facility managers, building occupants or equipment users,
the BMAR calculation almost becomes a real time estimate and follow-on
(after the baseline) condition assessments are not required. This is done
at some NASA locations currently. This procedure definitely depends on the
size of the inventory and the ability to incorporate the condition code
review without expending excessive resources. This procedure would not
only determine a more accurate calculation, but could provide additional
requirements information for the development of long-range plans. The more
current the condition code, the better the assessment of current and future
needs, and the more credible the calculation becomes. This is especially
recommended for locations with small or medium size plant inventories.
Step 9 - Limit the inventory if it is
cost-effective. A modification to this procedure to further reduce
costs should be considered. Instead of including all inventory items in
the calculation, it could be limited to the major facilities and their
equipment, and the results extrapolated to determine the BMAR for the
remaining assets. This would certainly make the process simpler for the
larger locations with large plant inventories. This modification should
be considered and possibly tested at all locations and applied where it
will be cost-effective.
Method 2 - This methodology is described in Deferred
Maintenance/Condition Assessment Discussion Paper, developed by Charles B.
Pittinger, Jr., Facilities Engineering Division, Headquarters National
Aeronautics and Space Administration (NASA), for presentation to the
National Research Council.
This process of documenting deferred maintenance is
designed to be a simplified approach based on creative thinking, which is
minimally resource intensive and auditable in order to support Federal
agencies annual financial reports. Its intended use is as a facility
performance metric, which can be compared and trended against other
commonly used facility metrics. It is a parametric estimate intended to be
accurate enough for its intended purpose - a MACRO level metric.
The method assumes condition assessments are
performed at the system level rather than the component level, simple
condition levels are used, there are a limited number of systems to assess,
and parametric estimating is used based on the CRV of the systems and the
facility they support.
A simple 5-tiered condition code system is proposed
which is assigned a representative repair cost factor based on a percentage
of the facility CRV. The range of CRV by condition level is subject to
further study.
| Condition Assessment Level | Repair Cost |
| 5 - New/Only PM required | 5% of CRV |
| 4 - Some repairs needed, system generally functional | 20% of CRV |
| 3 - Many repairs needed, limited functionality | 50% of CRV |
| 2 - May be functional, but obsolete or does not meet codes | 100% of CRV |
| 1 - Not operational, unsafe | 100% of CRV |
The major facility systems are identified and
assigned representative cost factors based on their estimated percentage
of the facility CRV. These factors can be adjusted for special facilities
(wind tunnels, launch platforms, etc.). The range of CRV by major system
is subject to further study.
| Major system | % of Facility CRV |
| Architectural | 5 |
| Roof | 10 |
| Electrical | 15 |
| Plumbing | 15 |
| HVAC | 25 |
| Structural | 30 |
| | 100 |
| Site | 100 |
| Utility Systems - exterior | 100 |
The procedure then determines the condition codes for
the systems, site and utilities for a given facility, multiplies the
appropriate repair cost factors and system cost factors for each and sums
them for the facility (site and utilities separate). This total system
factor is then multiplied by the facility CRV (same for site and utilities
CRV's) and added to the site and utilities calculation to come up with an
estimated value for the deferred maintenance for that facility.
The cost of gathering deferred maintenance data can
be reduced further by inspecting a smaller group of facilities that
represent the majority of an agency's CRV and then extrapolating for the
remainder of the assets.
This procedure is based on the condition of the
plant, and focuses on the system and facility level rather than the
component level. It involves a simplified condition code system and
parametric estimating to determine an approximation of a facility's BMAR.
Method 3 - This procedure was developed and suggested by Greg
Spencer, Chief, Maintenance and Logistics Branch, Dryden Flight Research
Center, during the NASA Facilities Maintenance Workshop, February 2000.
This is a condition-based method, which is a
simplified version of Method 1. It is a statistical model, which uses
real property data (CRV) and is based at the facility level rather than at
the equipment level. A facility is divided into three major systems, which
are assigned weighted percentages representing their expected impact on
overall facility condition, e.g., structural - 40%, mechanical - 30%, and
electrical - 30%. The process involves randomly selecting the proper
sample size of facilities (based on confidence level desired) and
determining each facility's overall net condition. This is done by
summing the product of each system's condition code (using standard NASA
5-tiered condition codes) and its weighted percentage. An example for a
single facility could be:
| System | Condition Code | System Weight |
| Structural | 3 | 40% |
| Mechanical | 3 | 30% |
| Electrical | 4 | 30% |
Facility Net Condition Code = (3 x 0.4)+(3 x 0.3)+(4 x 0.3) = 3.3
A Condition Code Factor (CCF) is then determined for
each facility. Based on actual data from DFRC, the CCF can be represented
by an exponentially decaying function (the CCF approaches zero
(exponentially) as the facility net condition code increases from one to
five (as shown in Figure 1 below).
This relationship between the CCF and the Net
Facility Condition is a reasonable expectation at most locations and could
be used as a standard assumption in using this method to approximate the
BMAR. The CCF can then be calculated using the formula:
CCF = k1(exp(k2( 1 - NC))) where:
CCF = condition code factor
k1 and k2 = constants (value of constants is subject to further study)
exp = "e" or 2.718
NC = the net condition code for the facility
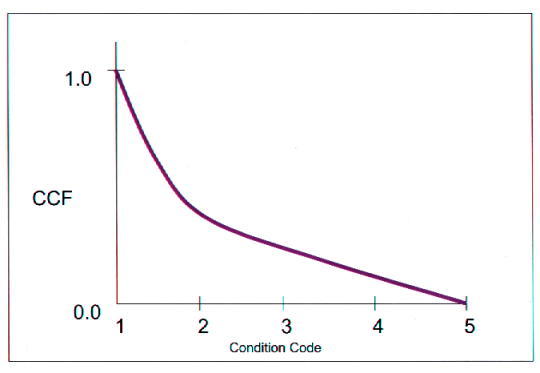
Figure H-2. CCF Relationship to Facility Net Condition
The approximation of the BMAR for the facility
involved is then determined by multiplying the CCF by the CRV for the
facility. The BMAR for the overall site is determined by averaging the
CCF for all facilities selected in the random sample, and multiplying that
average CCF by the total CRV for the site.
This process is strictly condition based and is a
simplified statistical calculation where lessor degrees of accuracy are
acceptable.
DISTRIBUTION:
NODIS
This Document is Obsolete and Is No Longer Used.
Check the NODIS Library to access the current version:
http://nodis3.gsfc.nasa.gov
![[NASA Logo]](../Images/nasaball.gif)