Procedural
Requirements
Effective Date: October 07, 2015
Expiration Date: October 06, 2025
|
|
NASA Procedural Requirements |
NPR 8831.2F Effective Date: October 07, 2015 Expiration Date: October 06, 2025 |
| | TOC | Change History | Preface | Chapter1 | Chapter2 | Chapter3 | Chapter4 | Chapter5 | Chapter6 | Chapter7 | Chapter8 | Chapter9 | Chapter10 | Chapter11 | Chapter12 | AppendixA | AppendixB | AppendixC | AppendixD | AppendixE | AppendixF | AppendixG | AppendixH | AppendixI | ALL | |
G.1 Facilities Maintenance Management Metrics
This appendix provides maintenance management metrics from various sources. Centers and Component Facilities should consider their use, as applicable, as a means of measuring performance.
G.1.1 Facility Condition
The annual maintenance funding and resultant trends are a function of the DM and the needs of the Center. If the DM is high and increasing or staying the same, a positive trend would be observed. A downward trend would be expected if the backlog is low or decreasing. Elimination of the DM is not always possible or desirable, since DM can provide an ability to balance resources in the long term. The following represents the applicable metrics and corresponding benchmarks:
a. Annual Maintenance Funding ($) should be between 2 percent and 4 percent.
Current Replacement Value ($)
b. Annual Maintenance Funding ($) should show a downward () or stable trend.
Current Replacement Value ($)
G.1.2 Work Performance
The following metrics and corresponding benchmarks are used to trend work performance:
a. Emergency TC Response (hours) should show a downward trend.
b. Emergency TC Completion (hours) should show a downward trend.
c. Average completion time for routine TC (hours) should show a downward trend.
d. Average completion time for repairs (days) should show a downward trend.
e. Jobs Completed as Scheduled (Number) should be 100 percent.
Total Jobs Scheduled (Number)
f. Service Requests Completed (Number) should be 100 percent.
Service Requests Committed (Number)
G.1.3 Work Element
G.1.3.1 The following metric may have a positive trend if repair rates are high, equipment/facilities systems are not realizing their full useful life, or there is very little PT&I usage. A negative trend should develop if PT&I is increasing and repair rates are stable or decreasing. The benchmark is between 15 percent and 18 percent (See Table 3-3):
Preventive Maintenance ($)
Total Maintenance Cost ($)
G.1.3.2 The following metric should develop a positive trend as the maintenance program shifts from reactive and time-based maintenance to condition-based maintenance. The benchmark is between 10 percent and 12 percent:
Predictive Testing and Inspection ($)
Total Maintenance Cost ($)
G.1.3.3 The following metrics should develop a negative trend as the maintenance program shifts from reactive and time-based maintenance to condition-based maintenance:
a. Programmed Maintenance Repair ($) should be between 25 percent and 30 percent.
Total Maintenance Cost ($)
b. Repair ($) should be between 15 percent and 20 percent.
Total Maintenance Cost ($)
c. Trouble Calls ($) should be between 5 percent and 10 percent.
Total Maintenance Cost ($)
G.1.3.4 The following metric should show an upward trend if a backlog of this type of work exists, and a negative trend if not much of this type of work exists at the Center. The benchmark is between 15 percent and 20 percent:
Replacement of Obsolete Items ($)
Total Maintenance Cost ($)
G.1.3.5 The following metric should show a negative trend, demonstrating increased focus on maintenance, and should be distinguished from customer reimbursed service requests. The benchmark is between 0 percent and 5 percent:
Service Requests ($)
Total Maintenance Cost ($)
G.1.4 RCM Performance Metrics
RCM analysis is an excellent indicator of performance.
G.1.4.1 Equipment Availability. The following metric is an indicator of equipment availability. The benchmark is 96 percent:
Hours Each Unit of Equipment is Available to Run at Capacity
Total Hours During the Reporting Period
G.1.4.2 Maintenance Overtime Percentage. The following metric is an indicator of maintenance overtime percentage. The benchmark is 5 percent or less:
Total Maintenance Overtime Hours During the Period
Total Regular Maintenance Hours During the Period
G.1.4.3 Emergency Percentage. The following metric is an indicator of the level of effort dedicated to emergency work. The benchmark is 10 percent or less:
Total Hours Worked on Emergency Jobs
Total Hours Worked
G.1.4.4 Percentage of Candidate Equipment Covered by PT&I. The following metric is an indicator of the amount of candidate equipment covered by PT&I. The benchmark is 100 percent:
Number of Equipment Items in the PT&I Program
Total Equipment Candidates for PT&I
G.1.4.5 Percentage of Emergency Work to PT&I and PM Work. The following metric is an indicator of the amount of emergency work relative to PT&I and PM work. The benchmark is 20 percent or less:
Total Emergency Hours
Total PT&I and PM Hours
G.1.4.6 Percentage of Faults Found in Thermographic Surveys. The following metric is an indicator of the percent of faults found through infrared thermography. The benchmark is 3 percent or less:
Number of Faults Found
Number of Devices Surveyed
G.1.4.7 Percentage of Faults Found in Steam Trap Surveys. The following metric is an indicator of the percentage of faults found during steam trap surveys. The benchmark is 10 percent or less:
Number of Defective Steam Traps Found
Number of Steam Traps Surveyed
G.1.4.8 Ratio of PM/PT&I Work to Reactive Maintenance Work. The following metric is an indicator of the percentage of planned work relative to unplanned work. The goal is 20%; world-class organizations keep reactive maintenance below 10%:
A = 80% PM/PT&I
B = 20% Reactive Maintenance where,
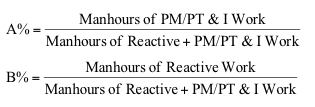
A% + B% = 100%
G.1.5 Safety
a. Reportable Incident Rate (RIR) for O&M and Support Services Contracts:
RIR = Total Annual No. of Injuries Incurred x 200,000
Total Annual No. of Hours Worked
a. Lost Workday Case Incident Rate (LWCIR) for O&M and Support Services Contracts. LWCIR represents the number of injuries and illnesses per 100 full-time equivalent workers.
N
LWCIR = EH x 200,000
Where N = the number of injuries and illnesses.
EH = the total hours worked by all employees during the calendar year.
200,000 is the base for 100 equivalent full-time workers (working 40 hours per week, 50 weeks per year).
G.2 Budget Execution. The following metrics indicate how well the facilities maintenance budget is being executed:
a. Prior Year Execution ($) should be 100%.
Prior Year Budget ($)
b. Current Year Expenditures to Date ($) should be 100%.
Current Year Budget to Date ($)
G.3 Other Metrics. The following are miscellaneous metrics used by organizations to measure performance. Their use by Centers is highly encouraged:
a. New Construction + Service Requests or New Work ($ or hours)
PM + PT&I + PGM + Repairs + ROI Maintenance ($ or hours) should show a downward trend (?).
b. Repairs + Trouble Calls Corrective Actions ($)
PM + PT&I + PGM + ROI or Preventive Actions ($)
?should show a downward trend (?).
c. Average Age of Equipment (years)
Average Useful Life of Equipment (years) should show a downward trend (?)
d. The number of disabling accidents per year should show a downward trend (?).
e. The number of routine trouble calls per year should show a downward trend (?).
f. The number of work orders (reactive) per year or month should show a downward trend (?).
g. The number of emergency trouble calls per year or month should show a downward trend (?).
h. Customer satisfaction, as measured by a numerical grade assigned to positive or negative feedback should show a positive, or upward, trend (?).
i. The number of unplanned electric power outages should show a downward trend (?).
j. The number of environmental violations should be zero.
k. The number of OSHA violations should be zero.
l. Maintenance Overtime (hours)
Total Maintenance (hours) should be less than 5%.
m. PMs Completed (number)
PMs Scheduled (number) should show an upward trend (?).
n. Scheduled Work (hours)
Total Work (hours) should show an upward trend (?).
o. Actual Cost of Work ($)
Estimated Cost of Work ($) should be within ± 10% of the estimated cost.
p. Jobs Planned and Estimated (number)
Total Jobs (number) should show an upward trend (?).
q. Jobs Planned and Estimated ($)
Total Jobs ($) should show an upward trend (?).
r. Supervision (hours)
Direct Labor (hours) should be less than 10%.
s. Downtime Caused by Breakdown (hours)
Total Downtime (hours) should show a downward trend (?) .
t. Breakdown Labor (hours)
Total Labor (hours) should show a downward trend (?).
G.3.1 The following two metrics should be carefully used on a job-by-job or like-work basis. This may create conflict between shops and management. Care should be exercised to preclude adversarial relationships between the shops and management.
a. Actual Hours per Job (hours)
Scheduled Hours per Job (hours) should be within ± 10% of the Scheduled Hours.
b. Maintenance Work Orders Completed (number
Maintenance Work Planned and Scheduled (number) ) should show an upward trend (?).
G.3.2 A downward trend of the spare parts inventory is desirable, provided that the maintenance response time and completion times are not adversely affected. Given that, the desired metric is:
Inventory value of spare parts should show a downward trend (?).
G.4.1 WBS Level 3 Definitions - Facilities (WBS 736466.06.0x)
| .01 | Utilities | Includes electricity, steam, natural gas, water, sewage, fuel oil, other energy sources, and energy conservation |
| .02 | Scheduled (proactive) Maintenance | Includes preventive maintenance, predictive testing and inspection, planned repair projects, programmed maintenance, replacement of obsolete items, and restoration/modernization associated with building systems/components. |
| .03 | Unscheduled (reactive) Maintenance | Includes trouble calls and breakdown repairs |
| .04 | Operations | Includes building and central plant operations, utilities control systems, CMMS, custodial/refuse collection/landfill costs, interior pest control |
| .05 | Inactive Buildings & Structures | Includes minimal maintenance costs to preserve an asset needed in the future (includes standby and mothballed facilities). Also includes minimal maintenance costs associated with preservation of historic facilities and, in rare cases, minimal costs associated with abandoned facilities if required for safety or security purposes. |
| .06 | New Capabilities | Includes construction projects that provide new capability at a Center. (e.g., a new addition to a building; a new parking lot; additional electrical capacity) |
| .07 | Other Facilities Services | Includes engineering support, configuration control, service requests, cost estimating support, real property management, master planning support, GIS support, surveys, permitting, ADA compliance, Center funded safety improvements, and renovation and modernization projects associated with workspace improvements. |
| .08 | Facilities Management | Includes all facilities civil service management (labor and travel). Does not include contractor management (must be allocated to service categories) or civil service or contractor craft labor. |
| .09 | Roads & Grounds Maintenance | Includes roads and grounds maintenance, landscaping, exterior pest control, grass cutting, snow removal |
| TOC | Change History | Preface | Chapter1 | Chapter2 | Chapter3 | Chapter4 | Chapter5 | Chapter6 | Chapter7 | Chapter8 | Chapter9 | Chapter10 | Chapter11 | Chapter12 | AppendixA | AppendixB | AppendixC | AppendixD | AppendixE | AppendixF | AppendixG | AppendixH | AppendixI | ALL | |
| | NODIS Library | Program Management(8000s) | Search | |
This document does not bind the public, except as authorized by law or as incorporated into a contract. This document is uncontrolled when printed. Check the NASA Online Directives Information System (NODIS) Library to verify that this is the correct version before use: https://nodis3.gsfc.nasa.gov.