Procedural
Requirements
Effective Date: October 07, 2015
Expiration Date: October 06, 2025
|
|
NASA Procedural Requirements |
NPR 8831.2F Effective Date: October 07, 2015 Expiration Date: October 06, 2025 |
| | TOC | Change History | Preface | Chapter1 | Chapter2 | Chapter3 | Chapter4 | Chapter5 | Chapter6 | Chapter7 | Chapter8 | Chapter9 | Chapter10 | Chapter11 | Chapter12 | AppendixA | AppendixB | AppendixC | AppendixD | AppendixE | AppendixF | AppendixG | AppendixH | AppendixI | ALL | |
9.1.1 Inadequate funding for maintenance and repair programs throughout the Federal Government has historically been a standing problem. Agencies' needs have received little sympathy from the highest levels of Government for several reasons, including the following:
a. There is an assumption that maintenance can always be put off for a month, a year, or even 5 years in favor of current operations with higher visibility and perceived as better payback on the investment.
b. The Federal Government decision making authority for maintenance and repair programs is widely dispersed and is not structured in a manner that properly places accountability and responsibility for the care of facilities on a specific steward.
c. The relationship of facilities to Agency missions has not been recognized adequately in the Federal strategic planning and budgeting process.
d. Definitions and calculations of facilities-related budget items, methodologies for developing budgets, and accounting and reporting systems for tracking and repair expenditures are inconsistent. A concern is that inappropriate items have been included in the maintenance backlog to inflate the overall estimate as justification for a higher budget appropriation.
e. Agencies have not satisfactorily convinced higher authority about the implications of deferral of funds that, when invested in preventive and timely maintenance, will be cost effective, protect the quality and functionality of the facilities, and protect the taxpayers' investment.
f. All of these are indicative of the reasons why good, convincing, standardized, and accurate data, presented in an organized and meaningful way, is so important to NASA.
9.1.2 This chapter discusses DM. (See the related discussions in Chapter 4, Annual Work Plan, and on Facility Condition Assessment in Section 10.6). DM is one of the metrics used by NASA and other Federal agencies to assess the condition of their real property assets. The trending of DM and other metrics help guide decision makers toward spending priorities for these assets in support of the Agency's mission. DM has become the topic of renewed interest, concern, and scrutiny within the highest levels of the Federal Government, including the U.S. Congress, the Office of Management and Budget (OMB), the Department of Defense, and the Department of the Treasury.
9.1.3 Definition. DM is the total of essential, but unfunded, facilities maintenance work necessary to bring facilities and collateral equipment to the required acceptable facilities maintenance standards. It is the total work that should be accomplished but that cannot be achieved within available resources. It does not include new construction, additions, or modifications. DM does include unfunded maintenance requirements, repairs, ROI, and CoF repair projects.
9.1.4 DM, when applied correctly, can be an excellent overall indicator of the condition of Center facilities and collateral equipment as a group. It reflects the cumulative effects of underfunding facilities maintenance and repair. Review of DM trends and comparison of DM with the CRV and facilities maintenance funding provide indications of the adequacy of the resources devoted to facilities maintenance.
9.1.5 Accurate and complete maintenance and repair program data is critical for NASA's obtaining the budget appropriations necessary to maintain its facilities so that they operate adequately and cost effectively, their functionality and quality are preserved, and they provide a safe, healthy, productive environment for the people who work and visit them every day. Further, as the steward of the facilities under its custody, NASA, and by extension, each Center, has an obligation to the public to realistically and truthfully report its critical, unfunded maintenance requirements and its impacts on mission. The DM is one of the tools by which the overall facility conditions, unfunded requirements, and the impacts on missions are reported. It should be kept in mind that, while the DM functions to report the conditions, it has not historically resulted in consistent or specific funding to address the shortfalls in maintenance funding. Recognizing and integrating the DM into the existing funding request process will be key to the success of obtaining actual funding in reducing DM.
9.1.6 With this perspective in mind, the work of communicating the funding needs for maintenance has not been completed until the DM results have been translated into funding requests, such as ROI, CoF, and program funded projects. Maintenance organizations should take an active leadership role in providing input to these various funding mechanisms. Input should include clear and concise language that defines the requirements, justifications, criticality, and urgency of these items as they relate to meeting mission and safety requirements. Through this methodology, maintenance organizations set the stage by which DM items become visible and take their proper place in the competition for funding among other construction and program needs.
9.2.1 Most constructed facilities are designed to provide at least a minimum acceptable level of shelter and service for 30 years. With proper management and maintenance, buildings may perform adequately well beyond their intended design life cycle and may adapt and serve several different functions.
9.2.2 The service life of a facility depends on many factors, such as the quality of the building's design, the durability of the construction materials and component systems, the incorporated technology, the location and climate, the use and intensity of use, and damage caused by human error and acts of God. These all influence how well and how quickly a facility ages and the amount of maintenance and repair it requires over its life cycle. Although a building's performance inevitably declines because of aging, wear and tear, and functional changes, its service life can be optimized through adequate and timely maintenance and repairs, as illustrated in Figure 9-1. Conversely, when maintenance and repair activities are continuously deferred, the result can be an irreversible loss of service life.
9.2.3 Facilities that are functionally obsolete, are not needed to support NASA's mission, are not historically significant, and are not suitable for transfer, adaptive reuse, stand by, or mothball, should be placed on the demolition list.
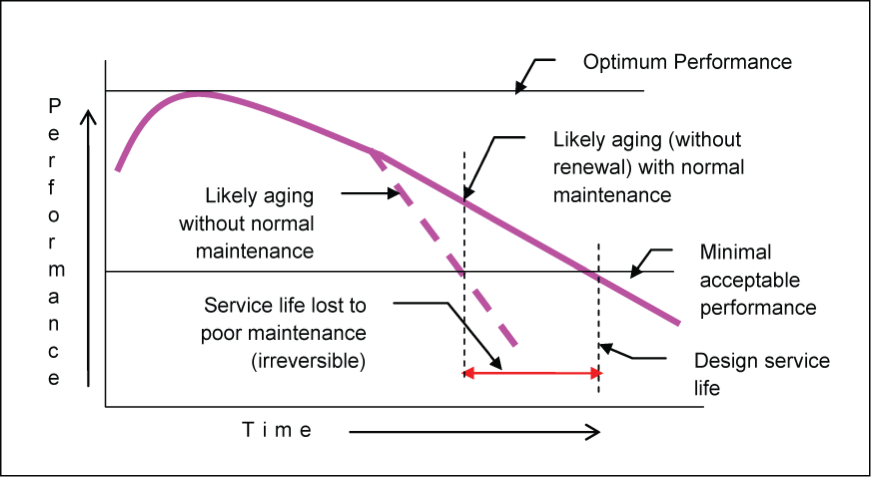
Figure 9-1 Effect of Adequate and Timely Maintenance and Repairs
on the Service Life of a Building (Appendix C.1, resource 21)
9.3.1 To be credible, the maintenance and repair estimates should be developed on the basis of a condition assessment of all facilities as follows:
a. All maintenance deficiencies should be identified and cost-estimated based on a current facilities condition assessment that includes input from continuous inspections.
b. Deficiencies that will be corrected as part of the current year AWP shall be subtracted from the estimates upon completion.
c. Deficiencies in facilities that do not support the Center's long-term or near-term mission goals, as articulated in the master plan, shall be included in the estimates.
d. The developed estimates should be reevaluated annually. This not only authenticates the work that continues to be deferred, but it also identifies work items in the estimates covering deficiencies that have progressed to the point where they absolutely need to be included in the AWP.
9.4.1 There is no single, agreed-upon guideline that determines how much funding is required to adequately maintain facilities. However, in 1990, the NRC (Appendix C.4, resource 1) recommended that, "An appropriate budget allocation for routine Maintenance and Repair (M&R) for a substantial inventory of facilities will typically be in the range of 2 to 4 percent of the aggregate current replacement value of those facilities."
9.4.2 Lacking an actual requirements-driven budget, the annual facilities maintenance budget should average 2 to 4 percent of CRV. (See Figure 2-1.) However, this rule of thumb applies only when the facilities have reached a steady-state maintenance condition (i.e., when the backlog has been reduced to an acceptable level). What an acceptable level is depends on the nature of the backlog and the mission of the Center. For example, a large backlog for interior painting may be acceptable, while a large backlog of roof repairs may indicate serious problems and should be reduced quickly.
9.4.3 Figure 9-2 illustrates the relationship between the backlog and annual maintenance funding levels as a percentage of CRV. It shows also a method of backlog reduction.
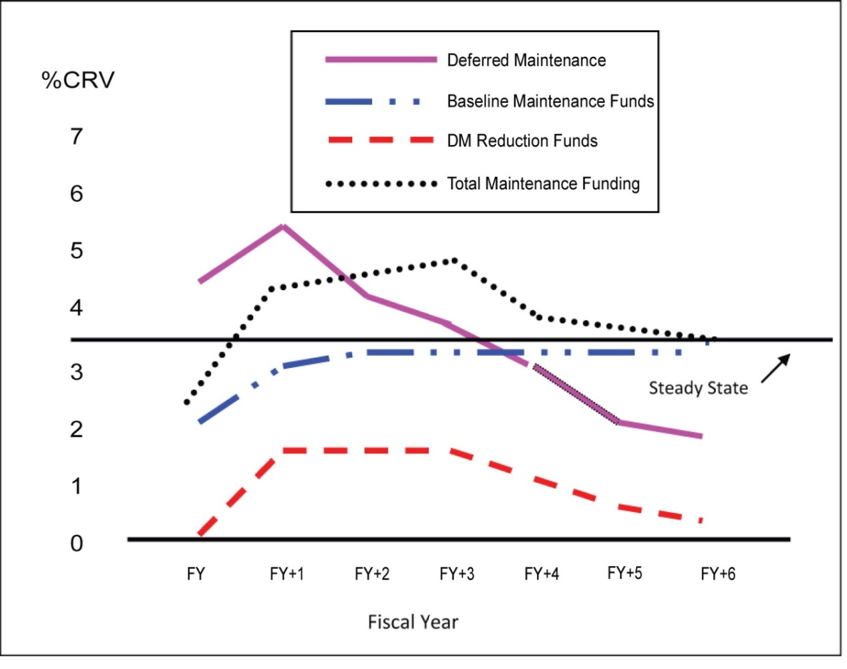
Figure 9-2 Typical DM Reduction Funding Profile
For illustrative purposes only, Figure 9-2 assumes that 3.5 percent of CRV is the optimum steady state maintenance funding level and that a backlog under 2 percent of CRV is acceptable. In this example, annual maintenance funding initially averages 2 percent of CRV, and the backlog is increasing each year. Then, baseline annual maintenance funding increases to 5 percent over a 2-year period, and additional funding is programmed for backlog reduction over a 6-year period. As the backlog is reduced to below 2 percent of CRV, special funding for backlog reduction decreases, but baseline maintenance funding remains at 3.5 percent. If the backlog begins to increase, maintenance funding should be increased again to reduce the backlog to below 2 percent of the CRV.
9.4.4 Metrics. Evaluation of DM and other maintenance performance indicators against a baseline is discussed in Section 3.11, Management Indicators, and listed in Appendix G. An elimination of the DM is not always possible or desirable since DM can provide an ability to balance resources in the long term. Appendix G lists other metrics, of which DM is a factor.
9.5.1 The FRED Maintenance & Operations Cost Study was done to determine, by modeling actual facilities, what NASA should be spending to sustain and operate facilities based on recommended requirements. Sustainment was defined as the amount of money required to properly maintain a facility without any degradation in condition from one year to the next, i.e. constant facility condition index (FCI). The ultimate goal of this study was to have another source of traceable documentation to use to justify maintenance budgets. To date, four types of NASA facilities were studied with the results shown in Table 9-1.
Table 9-1 FRED Maintenance & Operations Cost Study Results
| Building Type | Maintenance and Repair (% of CRV) | Operations (% of CRV) | Total M & R & Operations (% of CRV) | Total Cost/GSF (M & R and Operations) |
| Administrative Buildings | 2.2 | 2.3 | 4.5 | $11.46 |
| Propulsion Test Facilities | 0.7 | 0.7 | 1.5 | $14.04 |
| Communications Buildings/Data Centers | 5.3 | 4.7 | 10 | $42.40 |
| Space Science R & D Facilities | 1.9 | 2.1 | 4.1 | $18.16 |
Notes:
|
||||
9.5.2 In recent years, NASA has typically been funding maintenance at less than 0.9% of CRV. For years, people have been quoting the infamous 2% to 4 % from Committing to the Cost of Ownership (1990), but as can be seen, the costs vary significantly depending on facility type and use. The maintenance costs for propulsion buildings are low primarily because of intermittent use and the facilities consist of test cells filled with program support equipment for which the maintenance costs were not captured; however, the communications building maintenance costs— which includes data centers that run 24/7— are very high.
9.7.1 Maintenance and repair requirements and equipment condition are determined and validated through the facility condition assessment process. (See Chapter 10, Facilities Maintenance Standards and Actions, for more detailed discussion.) This assessment should be conducted continuously during normal PM and PT&I inspections, observations by the facility manager or other responsible individuals, and other work order repairs. It is important for the FCA process to focus on what is really important—mission; life, health, and safety issues; and systems most critical to a facility's performance—to optimize available resources, provide timely and accurate data for formulating maintenance and repair budgets, and provide critical information for the ongoing management of facilities.
9.7.2 NASA Centers shall identify and quantify facility conditions to support annual and 5-year work plans. The DM is the delta between the work requirements identified in the FCA and those that can be satisfied within the funding available. Adoption of the RCM philosophy, PT&I, CMMS, and proactive maintenance approaches provide Centers with information related to facility condition that was not previously available. These new information sources, coupled with increased customer and user input, have the potential to provide valuable FCA data without having to perform many of the discrete inspections required under the traditional FCA processes.
9.7.3 NPD 8831.1 requires that Centers continuously assess facility conditions to identify and quantify their DM so as to be 80-percent accurate at any time. Since a Center's facilities are in a constant state of change due to normal wear and tear, renewal tasks, and reconfiguration, the FCA process should be dynamic if an accurate estimate of a Center's condition is to be obtained. To facilitate this, all DM shall be maintained in the Center's CMMS in a format that can be updated with the results of the continuous inspection program and with additions to and deletions from the facilities and equipment inventory. The CMMS records should identify DM by facility and classify each item as mission critical, mission support, or Center support and further classify each item by the type of system, such as roofs, HVAC systems, structures, roads, or similar systems.
| TOC | Change History | Preface | Chapter1 | Chapter2 | Chapter3 | Chapter4 | Chapter5 | Chapter6 | Chapter7 | Chapter8 | Chapter9 | Chapter10 | Chapter11 | Chapter12 | AppendixA | AppendixB | AppendixC | AppendixD | AppendixE | AppendixF | AppendixG | AppendixH | AppendixI | ALL | |
| | NODIS Library | Program Management(8000s) | Search | |
This document does not bind the public, except as authorized by law or as incorporated into a contract. This document is uncontrolled when printed. Check the NASA Online Directives Information System (NODIS) Library to verify that this is the correct version before use: https://nodis3.gsfc.nasa.gov.